
Quick Start Guide
Get up and running with Infrasity Content Hub in minutes.
A short walkthrough of the four features you'll use most: plan work in Sprints, track post-publish performance in Referrals, monitor AI visibility in the GEO Dashboard, and drill into a single topic in the Cluster page.
1. Sprints
Sprints are time-bound work cycles (e.g. one month) that group all your planned content. Each sprint tracks total topics, stage-wise counts (Outline, Writing, In Review, Published), and overall sprint progress.
Content Sprints view
The Content Sprints page lists every sprint, past, current, and upcoming, with progress, topic counts, and status at a glance.

- Click + New Sprint to create one, set its date range, and it appears here as Upcoming until its cycle starts.
- Each sprint card shows Topics, Published, In Review, and In Progress counts, plus a View Sprint link into its Overview.
Adding a topic
Opening a sprint takes you to its Overview, where you plan and track the work. To plan work, add a topic to the sprint:
- Click + Add Topic (or Import from Blog to pull in an existing post).
- Fill in the topic's details: this is where the important tracking information lives.
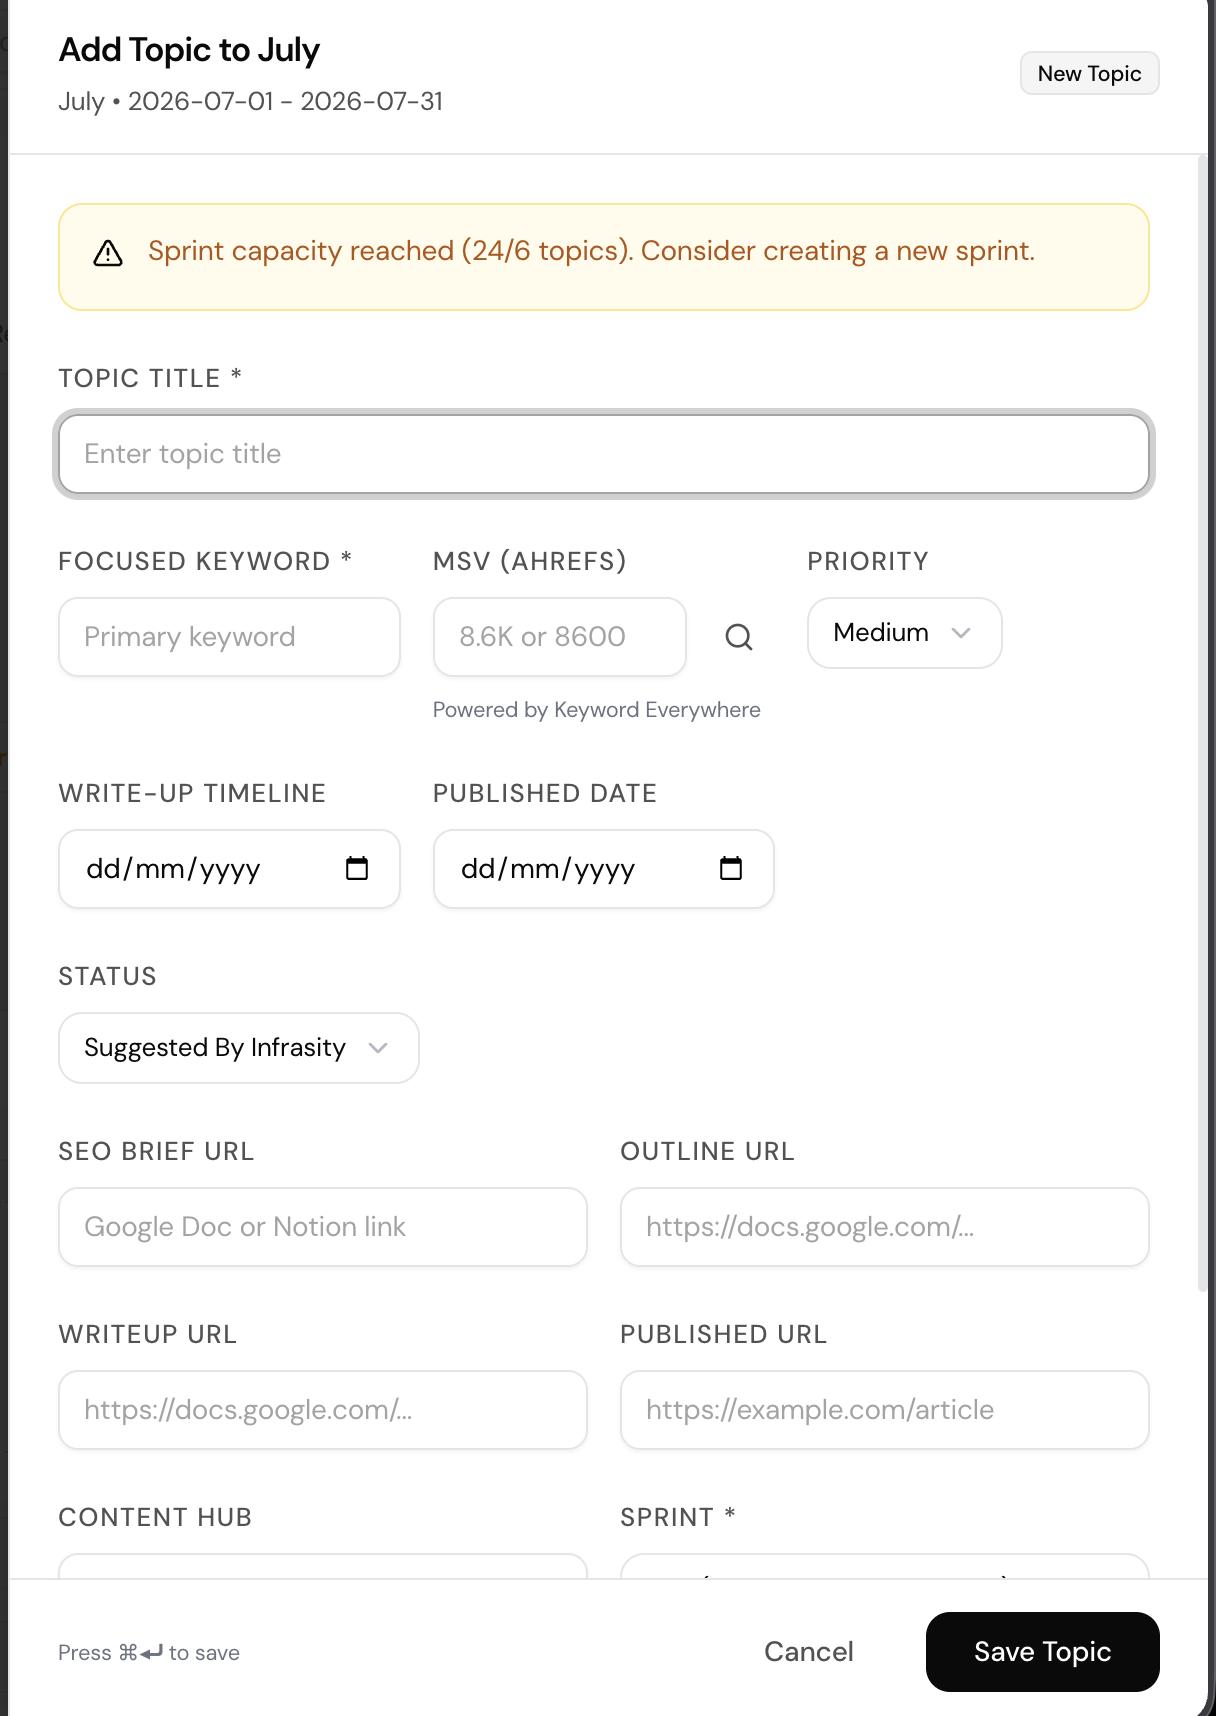
Each topic captures:
- Topic Title & Focused Keyword: the core subject and primary SEO keyword.
- MSV (Ahrefs) & Priority: monthly search volume and how urgent the topic is.
- Write-up Timeline & Published Date: when it's due to be drafted and when it went live.
- Status: e.g. Suggested, Outline, Writing, In Review, Published.
- SEO Brief, Outline, Writeup & Published URLs: links to every stage of the content's lifecycle.
- Content Hub tags & Sprint: grouping tags and which sprint the topic belongs to.
See Creating a Sprint and Adding & Editing Topics for the full breakdown of every field.
2. Referrals
Referrals is your SEO and AI traffic dashboard. It pulls data from Google Search Console and GA4 to show clicks, positions, sessions, and, importantly, how often AI crawlers (ChatGPT, Gemini, Perplexity) are visiting your pages. By comparing metrics such as clicks, positions, sessions, and crawler hits against previous time periods, the dashboard helps teams ensure their content remains accessible to AI engines while tracking overall organic search health.
- Compare clicks, sessions, and positions against prior periods.
- Check Top Referrals to see which AI models are sending traffic.
See Referrals for the full page breakdown.
3. GEO Overview
The GEO Dashboard tracks how often your site is cited as a source by AI models. It shows your overall citation rate, trend over time, and a per-model breakdown, plus flags your biggest content gap. It shows platforms like ChatGPT, Gemini, and Perplexity are accessing your pages, comparing metrics such as clicks, positions, sessions, and crawler hits against previous time periods.

- Citation Rate: % of tracked prompts where you were cited.
- AI Model Citation Rates: breakdown by Perplexity, ChatGPT, Gemini, Claude.
- Biggest Gap: the cluster with the most uncited prompts, your next content priority.
See GEO Dashboard Overview for the full page breakdown.
4. Cluster Page
A Cluster page is a deep-dive into a single topic (e.g. "Developer Marketing"). It tracks your citation trend, share of voice against competitors, and lets you turn on Auto-Monitor for continuous tracking.

- Citation Trend: your citation rate over the last 7 scans.
- Share of Voice: who gets cited most within this topic.
- Auto-Monitor: toggle on to track this cluster automatically over time.
See Clusters for the full page breakdown.
Related Pages
Sprints
Plan and execute content in organized sprint cycles.
Referrals
Your SEO and AI crawler traffic dashboard, pulling from Google Search Console and GA4.
GEO Dashboard Overview
Monitor your AI visibility and citation performance across LLMs.
Clusters
Group related prompts into clusters for theme-level analysis.